Actions Runner Controller on k3s: Four Traps and an MTU That Ate the Pipeline
For about a year my CI ran on three machines I built by hand. Two Fedora boxes and one appliance with a read-only root filesystem, each with a GitHub Actions runner installed as a service, running as my own user, with passwordless sudo and the Docker socket, next to fifteen gigabytes of Yocto build trees.
That works. It also means every job inherits whatever the last job left behind, and that the answer to "what scanned this commit?" is "whichever machine was free". I had already pushed the tooling into pinned containers for exactly that reason. The remaining variable was the host.
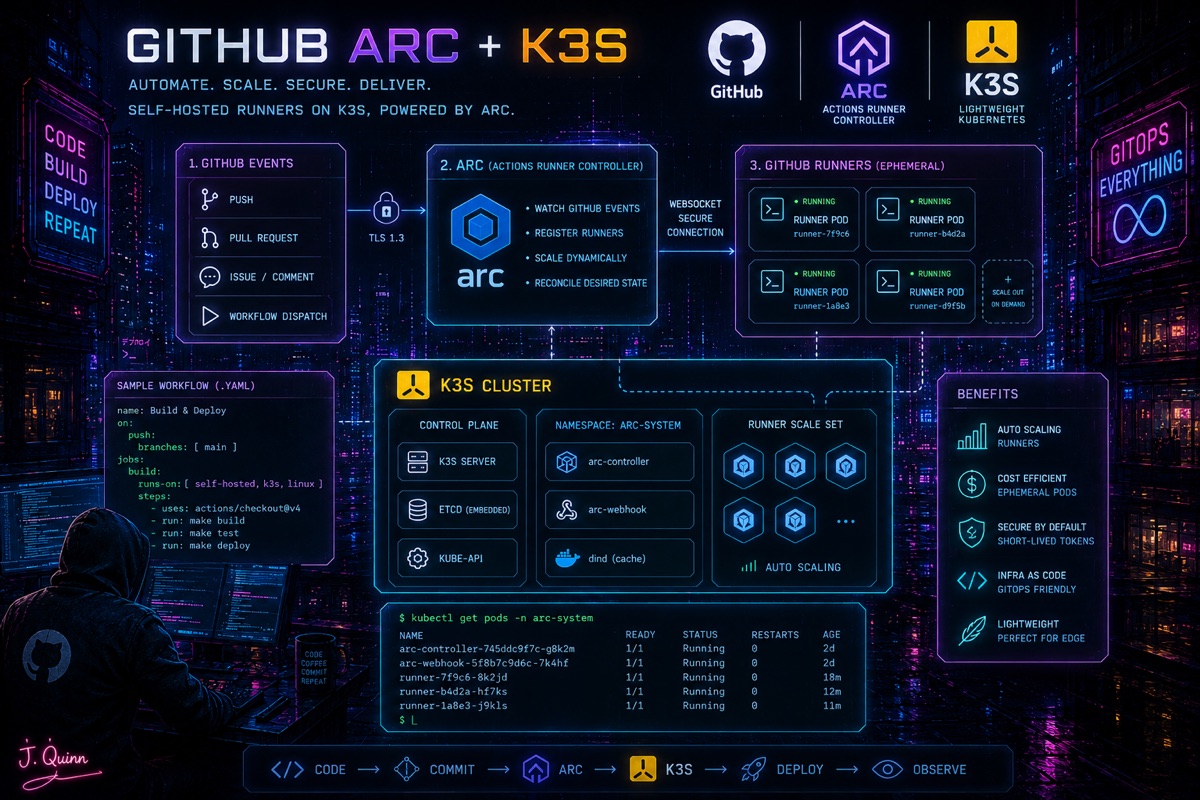
So the three builders became one three-node k3s cluster running Actions Runner Controller, and every job now gets a pod that is created for it and destroyed afterwards. The architecture took an afternoon. The four traps below took considerably longer, and the first one is the best bug I have hit this year.
The shape of it
k3s v1.36.3+k3s1 across the three former builders, all three as servers with
embedded etcd. ARC gha-runner-scale-set 0.14.2, controller in arc-systems,
runner pods in arc-runners. One scale set per repository, because both GitHub
accounts involved are User accounts rather than organizations, so there is no
org-scoped runner group to pool capacity across. minRunners: 0,
maxRunners: 2.
The one piece of configuration that saved real work:
scaleSetLabels:
  - self-hosted
  - builder
ARC used to be addressable by exactly one label, its installation name.
Multi-label targeting landed in 0.14.0, so the scale set can declare the same
labels the old machines carried, and every runs-on: [self-hosted, builder] in
every workflow keeps working untouched. Nothing in the repository had to change
to move the jobs.
That also means routing is not enforced by the workflow. It is enforced by there being nothing else registered. After the migration:
$ gh api repos/OWNER/REPO/actions/runners --jq '.total_count'
0
Zero long-lived runners, and the scale set is the only thing that can claim a job. If you leave the old machines registered with the same labels, jobs go to whichever answers first, and you will spend an afternoon wondering why your change only sometimes takes effect.
Container mode is dind, because these pipelines build and push images. That
means a privileged sidecar, which gives back some of the isolation that
motivated the move. I do not have a better answer; it is the documented cost.
Trap 1: the pod network is 1450, and dockerd's bridge is 1500
The first thing that ran on the new runners was the weekly Renovate job. It failed after two and a half minutes:
fatal: unable to access 'https://github.com/OWNER/REPO.git/':
Recv failure: Connection reset by peer
"result": "unknown-error"
A reset while cloning, on a job that had worked for months. The obvious suspects are the token and the network, and both look fine: the pod had already authenticated, and the runner itself had just checked out the same repository successfully in the step above.
That last detail is the whole bug, and I walked past it twice. actions/checkout
runs in the runner container. Renovate runs in a container the runner
starts, on the dind daemon's bridge. Those are two different networks.
From a throwaway pod, on the pod network:
$ kubectl run netdiag --rm -it --image=alpine:3.22 -- sh
/ # git ls-remote --heads https://github.com/actions/runner.git | wc -l
290
/ # curl -sS -o /dev/null -w '%{http_code} %{size_download}\n' \
      https://codeload.github.com/actions/runner/tar.gz/refs/tags/v2.336.0
200 16003974
Perfect. Then the same two commands from a container started inside a dind pod, which is what a job actually does:
=== dind bridge mtu=1500 (the chart default) ===
  ls-remote rc=128 refs=0
fatal: unable to access '...': Recv failure: Connection reset by peer
  curl http=000 bytes=0
curl: (35) Recv failure: Connection reset by peer

=== dind bridge mtu=1450 ===
  ls-remote rc=0 refs=290
  curl http=200 bytes=16003974
Fifty bytes.
The pod network was flannel with the VXLAN backend, k3s's default, which takes 50 bytes of encapsulation overhead off a 1500-byte link and gives pods an MTU of 1450:
$ ip -o link show flannel.1
flannel.1: <BROADCAST,MULTICAST,UP,LOWER_UP> mtu 1450 ...
$ ip -o link show cni0
cni0: <BROADCAST,MULTICAST,UP,LOWER_UP> mtu 1450 ...
dockerd inside the dind sidecar knows nothing about that. It creates docker0
at its default 1500. So a container a job starts emits full-size frames that
cannot traverse the interface they have to leave through, and path MTU discovery
does not rescue it.
The reason this is so confusing to debug is the shape of the failure. TLS handshakes are small, so they complete. DNS is small, so it resolves. Every cheap diagnostic you reach for passes. The connection dies on the first response large enough to need a full-size frame, which reads exactly like a flaky network or a rate limit, and it is neither: it is deterministic, and it reproduces on demand once you know where to look.
What it would have taken down, had Renovate not gone first: freshclam fetching
virus signatures, Grype's vulnerability database, Trivy's database, and every
RUN step of the image build, which is where pnpm install lives. Essentially
the whole pipeline, all of it presenting as intermittent network trouble.
There are two places to fix this, and I ended up using both.
The immediate one is a flag on the daemon:
args:
  - dockerd
  - --host=unix:///var/run/docker.sock
  - --group=$(DOCKER_GROUP_GID)
  - --mtu=1450
The better one is to remove the mismatch at the source. VXLAN is only necessary
if pods have to reach each other across networks that cannot route to one
another. Every node in this cluster sits on the same layer 2 segment, so flannel
can use host-gw, which adds routes instead of encapsulating:
# /etc/rancher/k3s/config.yaml
flannel-backend: host-gw
With that, there is no flannel.1 device at all, cni0 comes up at 1500, and
dockerd's default matches the network it is nested inside:
$ ip -o link show flannel.1
Device "flannel.1" does not exist.
$ ip -o link show cni0
cni0: <BROADCAST,MULTICAST,UP,LOWER_UP> mtu 1500 ...
I kept --mtu=1450 anyway. It costs 50 bytes per frame, and it means a future
cluster rebuild that quietly restores the VXLAN default cannot take CI down
again. That is a trade I would make every time: the failure mode is a bug that
reads as a flaky network and costs a day, and the insurance is a rounding error
on throughput.
If your nodes are not on one segment, host-gw is not available to you and the
flag is the whole answer. If you are on WireGuard or a tunnel, the number is
smaller again. The lesson is not 1450. The lesson is that the MTU of a
container started by a job is not something anyone configures by default, and
nothing in the ARC documentation puts it in front of you.
Trap 2: the chart will not let you set that flag
Having found a one-flag fix, I went looking for the value that sets it. There isn't one.
With containerMode.type: dind, the chart generates the sidecar from a template
with the arguments written into it:
{{- define "gha-runner-scale-set.dind-container" -}}
image: docker:dind
args:
  - dockerd
  - --host=unix:///var/run/docker.sock
  - --group=$(DOCKER_GROUP_GID)
...
No hook, no extraArgs, and the image is fixed too. The obvious workaround is
to declare your own container named dind in template.spec and let it merge.
That does not work either, because the chart explicitly skips it:
{{- define "gha-runner-scale-set.non-runner-non-dind-containers" -}}
    {{- if and (ne $container.name "runner") (ne $container.name "dind") }}
So while containerMode is set, a container of yours called dind is dropped
on the floor. Quietly. You get the chart's version and no warning that yours was
ignored.
The supported route is to stop using containerMode entirely and write the pod
out yourself. The chart documents this in values.yaml as a commented example:
an init container that copies the runner's externals into a shared volume, the
dind sidecar as a native sidecar with restartPolicy: Always, the runner
container with DOCKER_HOST pointed at the shared socket, and three emptyDirs.
Roughly sixty lines to reproduce exactly what the two words type: dind gave
you, plus your one flag.
I recommend copying that example verbatim and diffing it against what the chart actually generated for you before you changed anything:
$ kubectl get autoscalingrunnerset -n arc-runners NAME -o jsonpath='{.spec.template.spec}' \
    | python3 -m json.tool
That output is the ground truth for what you are trying to reproduce. Two of its properties turned out to matter later, and both are easy to break by hand:
- The
workemptyDir is mounted at/home/runner/_workin both the runner and the dind sidecar. That identical path is what makesdocker run -v "${{ github.workspace }}:/scan"resolve to the right directory in the daemon. Get it wrong and your bind mounts silently mount empty. dind-sockis mounted at/var/runin both, which is why a job can pass/var/run/docker.sockinto a scanner container at all.
Trap 3: the runner image cannot run Node
With the network fixed, the pipeline got further and then failed in two jobs at once:
Attempting to download 26...
/home/runner/_work/_tool/node/26.7.0/x64/bin/node: error while loading shared
libraries: libatomic.so.1: cannot open shared object file: No such file or directory
actions/setup-node did its job perfectly. It downloaded the Node build for
generic Linux, put it in the tool cache, and the binary would not start.
ghcr.io/actions/actions-runner is built on dotnet/runtime-deps:8.0-noble
plus git, curl, jq, unzip, sudo and the Docker CLI. It is deliberately minimal.
It is not a GitHub-hosted runner image with a hundred preinstalled toolchains,
and it does not carry the shared libraries a downloaded toolchain might expect.
Three ways out:
sudo apt-get install -y libatomic1in a step. Works, and it is an operating system package install in a workflow, on a pod, every single run.- Maintain a custom runner image with the libraries you need. Correct, and now you own another image build on the same hardware you are trying to free up.
- Put the toolchain in a container, like every other tool in the pipeline.
I took the third, which had the pleasant side effect of finishing a job I had
deliberately left half done. When I had moved the scanners into pinned
containers earlier, I left lint and type checking on actions/setup-node, on
the grounds that they already provisioned their own toolchain and containerising
them would cost the pnpm store cache. On ephemeral pods there is no store cache
to lose, and setup-node does not work. The argument for the exception
evaporated from both ends at once.
- name: Lint
  run: |
    docker run --rm \
      --user "$(id -u):$(id -g)" \
      --volume "${WORKSPACE}:/work" --workdir /work \
      --env HOME=/work/.ci-home \
      --env NPM_CONFIG_PREFIX=/work/.ci-npm \
      "$NODE_IMAGE" sh -euc '
        npm install -g "$(node -p "require(\"./package.json\").packageManager")"
        export PATH=/work/.ci-npm/bin:$PATH
        pnpm install --frozen-lockfile --store-dir /work/.pnpm-store
        pnpm lint
      '
Three details in there are load-bearing, and I got each of them wrong once first:
-
--user "$(id -u):$(id -g)". Without it the container runs as root and everything it writes into the workspace is root-owned. On an ephemeral pod that is survivable because the workspace dies with the pod, but it is a trap the moment a workspace is ever reused, and on the old machines it had already left a root-ownedgrype.jsonsitting in a checkout. -
NPM_CONFIG_PREFIXpointed into the workspace.npm install -gwants to write to/usr/local/lib, which a non-root user cannot do. Redirect the prefix rather than reaching for root. -
pnpm comes from the
packageManagerfield. Node 26 removed corepack, sonode:26-alpineships neither corepack nor pnpm:$ docker run --rm node:26-alpine sh -c 'node -v; npm -v; which corepack || echo ABSENT' v26.7.0 11.19.0 ABSENTReading the version out of
package.jsonkeeps it declared in one place rather than pinned separately in a workflow.
The pinned image tag and .nvmrc are now two statements of the same fact, which
is a small lie waiting to happen, so each job asserts they agree before using
the image. It is three lines and it will eventually save someone an afternoon.
Trap 4: rootless BuildKit will not mount /proc
The last piece was the image build. The obvious thing is to leave docker build
alone; there is a daemon in the pod, and it works. I did not, for a reason that
is the same reason the scanners are pinned: docker build uses whatever
BuildKit is compiled into the daemon, so the build engine becomes a property of
whatever the docker:dind tag resolves to today. On the old machines that
already differed between hosts, one on Docker 29.7 and one on a distribution
package of 26.1. Pinning the scanners and leaving the thing that produces the
artefact unpinned is a strange place to stop.
So BuildKit as a pinned container. The rootless variant, because the sidecar is already privileged and there is nothing to gain by making the build container privileged as well. It failed immediately:
runc run failed: unable to start container process: error during container init:
error mounting "proc" to rootfs at "/proc": mount src=proc, dst=/proc,
flags=MS_NOSUID|MS_NODEV|MS_NOEXEC: operation not permitted
Rootless BuildKit wants to create its own process sandbox for each build step, and in this nesting it cannot. The documented answer is to tell it not to try:
docker run --rm \
  --security-opt seccomp=unconfined \
  --security-opt apparmor=unconfined \
  --env BUILDKITD_FLAGS=--oci-worker-no-process-sandbox \
  --volume "${WORKSPACE}:/work" --workdir /work \
  --entrypoint buildctl-daemonless.sh \
  "$BUILDKIT_IMAGE" \
  build \
    --frontend dockerfile.v0 \
    --local context=/work \
    --local dockerfile=/work \
    --output "type=docker,name=${IMAGE_REF}" \
| docker load
Be honest about what that flag costs: build steps no longer get their own PID namespace. The build is isolated from the runner and not much more, and the pod boundary is what is actually protecting the cluster. "Rootless" here buys you a build container without privileges of its own, inside a sidecar that has them.
That version worked, and I ran it for exactly one day before replacing it, because starting a daemon per job also means throwing its cache away per job. The better shape is one long-lived rootless buildkitd in the cluster with its cache on a PersistentVolume, and a job that runs only the client:
docker run --rm \
  --volume "${WORKSPACE}:/work" --workdir /work \
  --entrypoint buildctl \
  "$BUILDKIT_IMAGE" \
  --addr tcp://buildkitd.arc-runners.svc.cluster.local:1234 \
  build \
    --frontend dockerfile.v0 \
    --local context=/work \
    --local dockerfile=/work \
    --output "type=docker,name=${IMAGE_REF}" \
| docker load
Every one of those security options disappears, because nothing starts a daemon in the job any more. The client streams the build context to the daemon and the resulting tarball streams back.
The part I expected to be a problem and was not: this container sits on the dind bridge, not on the pod network, so reaching a ClusterIP service is not obviously going to work. It does. The bridge NATs out through the pod, which means kube-dns resolves the service name and kube-proxy routes the address:
$ docker run --rm --entrypoint buildctl "$BK" \
    --addr tcp://buildkitd.arc-runners.svc.cluster.local:1234 debug workers
ID                          PLATFORMS
ae0ypgxwzozultpq4eq713a07   linux/amd64,linux/amd64/v2,linux/arm64,...
Check that with debug workers before you rewrite a build step around it.
The last line is the important one. BuildKit can push straight to a registry,
and that would be simpler. It would also put the image in the registry before
any scanner had looked at it, which is the exact gate placement I had fixed
weeks earlier: scanning has to sit between the build and the push, or a pull
request merges green on findings nobody saw. Streaming a docker-format tarball
into docker load puts the image in the local daemon, where the SBOM, Trivy,
Grype and size steps find it exactly where they always did. Not one of those
steps changed.
One assertion is worth adding after it:
if ! docker image inspect "$IMAGE_REF" >/dev/null 2>&1; then
  echo "BuildKit did not load ${IMAGE_REF} into the daemon" >&2
  exit 1
fi
docker load reports success on a truncated stream as readily as on a whole
one. Without that check, a partial build leaves the previous image carrying the
tag, and the scanners dutifully scan the wrong thing and pass.
What ephemeral actually costs
Everything that used to be warm starts cold, every run:
- No pnpm store, no tool cache. Both jobs install dependencies from scratch.
- Roughly a gigabyte of ClamAV pulled per virus scan.
- Every action tarball re-downloaded, six per run here.
On the first fully green run, on Atom C3758 cores over a home uplink:
| Job | Duration |
|---|---|
lint | 56s |
typecheck | 50s |
virus-scan | 1m12s |
build | 7m22s |
The build was the one worth attacking, and moving it to the shared buildkitd is what took the layer cache off that list: the daemon outlives the pod, so its cache does too. That is the general shape of the answer. A cache an ephemeral runner can keep is one that lives somewhere else and is addressed over the network, whether that is a PersistentVolume behind a daemon or a registry. Anything you mount from the node re-couples jobs to that node and hands back what you moved to Kubernetes to get.
The concurrency limit is worth a second look too. Mine was maxRunners: 2,
written when the plan was two builders sharing their cores with interactive
work. On a three-node cluster with the jobs in this workflow having no
dependencies between them, that setting was making four jobs queue two at a time
while most of the hardware idled.
Read the trace, not the tick
One habit is worth keeping through a migration like this, because a migration is exactly when it pays. A green check mark means no step returned a non-zero exit code. It does not mean the work happened.
The scan job on the first green ARC run reported:
freshclam: signatures updated
Known viruses: 3628010
Scanned files: 201
Infected files: 0
Those numbers are the point. A signature count of zero and a signature count of
3.6 million produce the same green tick, and I know that because an earlier
incarnation of this job ran for weeks with an empty database, erroring on every
file and passing every time, because it only failed when it found a virus and an
empty database can never find one. freshclam: signatures updated also happens
to be the single best proof that Trap 1 is really fixed: that line is a nested
container downloading over the network, which is precisely what a 1500-byte MTU
was killing.
What I would tell someone starting this
- Reproduce nested-container networking before you migrate anything. Start a
dind pod, run
docker run alpine/git ls-remoteagainst something real, and download twenty megabytes. If either fails, you have found your MTU before it costs you a day of blaming credentials. - Read the chart's templates, not just
values.yaml. The thing you need to configure may not be configurable, and the chart may drop your override without saying so. - Assume the runner image has nothing. No Node, no Python, not even the shared libraries a downloaded toolchain needs. Anything beyond git and Docker comes in a container or comes in an image you maintain.
- Keep one property when you move. Mine was that a result is a property of the commit and the workflow file, not of the machine. That single rule decided the dind flag, the pinned Node image, and the pinned BuildKit, and it is the reason the migration ended with fewer variables than it started with rather than a different set.
The pipeline is now four jobs on pods that did not exist a minute before they ran and will not exist a minute after. Nothing is installed anywhere. The next person to ask what scanned a given commit gets to read one file to find out.