Running FluxCD GitOps on a 1 vCPU VPS: Six Traps and a CI Pipeline That Lied
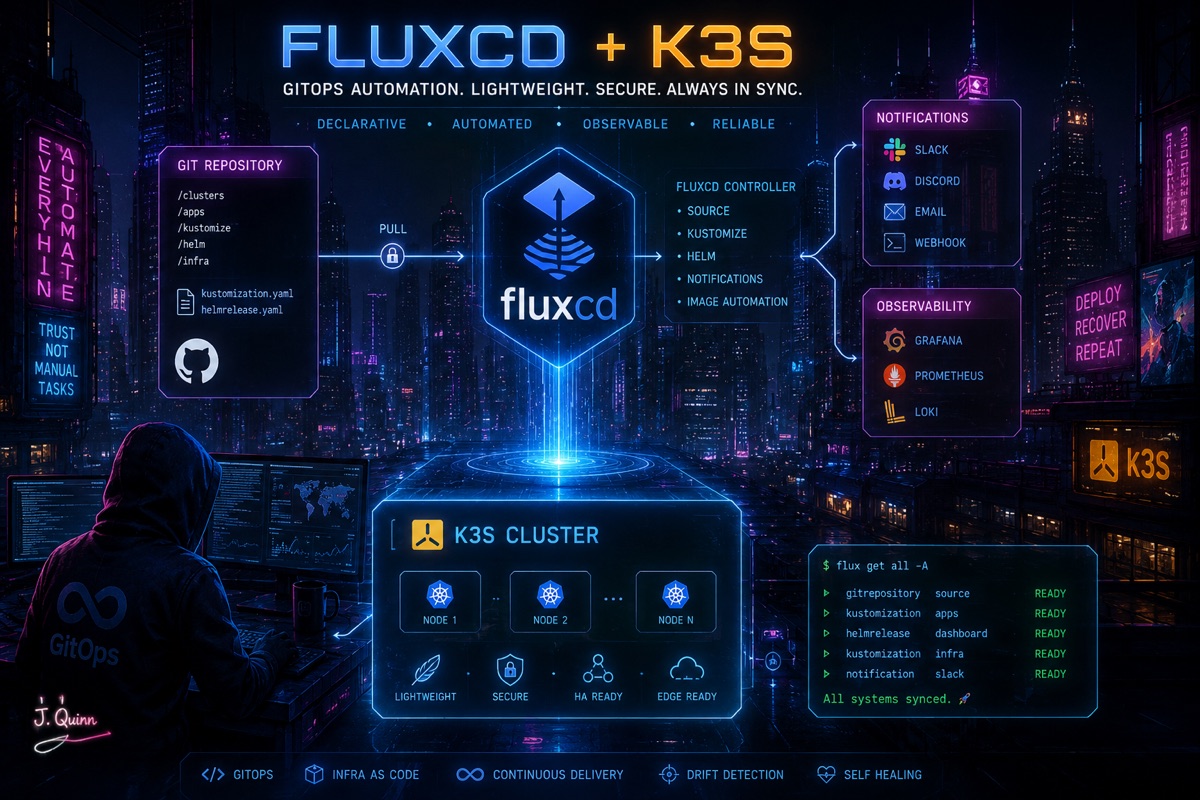
This site is a Next.js app with a WebGL hero and a handful of blog posts. It has no database, no user accounts, and no background workers, and it gets the traffic a personal site gets. The entire production environment is one VPS with 1 vCPU, 4 GB of RAM, and a 50 GB disk.
I moved it from Docker Compose to a single-node k3s cluster reconciled by Flux v2.9. That is an absurd amount of machinery for one static-ish app, and I am not going to argue otherwise. I did it because I wanted the deployment path for my own site to match the one I reason about at work, and because the old path had a specific failure I was tired of.
What follows is what actually went wrong. The architecture took an afternoon. The traps took considerably longer, and most of them were invisible in the documentation I was reading at the time.
What the old deploy did, and why it was bad
The previous pipeline was a GitHub Actions job that fired on version tags. It held an SSH private key in Actions secrets, connected to the VPS, and ran something close to this:
sed -i "s|^IMAGE_TAG=.*|IMAGE_TAG=${TAG}|" /opt/site/.env
docker rm -f site proxy
docker compose -f /opt/site/docker-compose.yml up -d
Read that middle line again. Every release removed the reverse proxy along with
the app, so every release took TLS termination down for as long as it took the
proxy to come back and reload its certificate store. Nothing was broken exactly;
requests in that window just failed. It was maybe fifteen seconds. It was
fifteen seconds every single time, for no reason, because a docker rm -f on
the app container had been copied and extended to cover both.
I could have fixed that line. That is the point I want to make about pull-based deployment: fixing the line fixes the instance, not the class. The class of problem is that a push-based deploy is an imperative script running with root on a machine, with a long-lived credential, doing whatever the last person to edit it wrote. The next version of that script will have a different bug in it.
Under GitOps the CI pipeline builds an image, scans it, pushes it to a registry, and stops. It holds no credential that reaches production. The cluster pulls what it should be running from a git repository and converges on it. A release is a commit. A rollback is a revert.
The shape of the thing
The VPS runs k3s. k3s bundles Traefik as its ingress controller, which
terminates TLS with a Let's Encrypt certificate obtained over TLS-ALPN-01. Flux
runs in flux-system and reconciles a private GitOps repository (call it
homelab-gitops) whose layout is roughly:
clusters/vps/
  flux-system/          # the Flux components themselves
  infrastructure/       # Traefik configuration, namespaces, secrets refs
  apps/
    site/
      deployment.yaml
      service.yaml
      ingressroute.yaml
The site's own repository never touches the cluster. It builds
ghcr.io/OWNER/site:<tag> and pushes. Something has to notice the new tag and
write it into the GitOps repository, and Flux's image automation controllers do
that, which is where the strangest behaviour in this whole exercise lives. I
will come back to it.
k3s plus Flux plus Traefik plus the app fits in 4 GB, but not with room to spare. This is not a box where you get to be careless about what runs on it, which is how the first trap found me.
Trap 1: disabling local-storage also deletes your default StorageClass
The instinct on a 4 GB box is to turn off anything you are not using. k3s ships several optional components, and I did not think I needed a storage provisioner for a stateless site, so I started the server with:
k3s server --disable=metrics-server --disable=local-storageTraefik came up. TLS did not. The Traefik pod sat in Pending, and the reason
was one level down:
$ kubectl -n kube-system describe pod traefik-...
Events:
  Warning  FailedScheduling  pod has unbound immediate PersistentVolumeClaims

$ kubectl -n kube-system get pvc
NAME      STATUS    VOLUME   CAPACITY   ACCESS MODES   STORAGECLASS   AGE
traefik   Pending                                      <none>         14m
STORAGECLASS is empty. Not "local-path", not "missing", empty. The claim was
written without an explicit class, which means Kubernetes resolves it to
whatever StorageClass carries the
storageclass.kubernetes.io/is-default-class: "true" annotation. There was no
such class, because there was no StorageClass at all.
The k3s prose documentation describes local-storage as the local path
provisioner. It does not say that the packaged manifest which installs the
provisioner is also the manifest that defines the local-path StorageClass and
marks it default. You can only see that by reading the manifest k3s lays down on
disk. Disabling the component takes the class with it, and every claim in the
cluster that does not name a class explicitly is stranded forever with no error
that says why.
Traefik wanted that PVC for acme.json, the file where it persists the
Let's Encrypt account key and issued certificates. No volume, no acme.json, no
certificate. I re-enabled local-storage and it bound in seconds.
The general lesson is worth more than the specific flag: when a distribution gives you an on/off switch for a "component", find out what the component's manifest actually contains before you turn it off. In k3s those manifests live on the server and are readable; nobody stops you.
Trap 2: the VPS's DHCP made Let's Encrypt resolve to localhost
This is the best one. It cost most of a day and the fix is two lines.
Traefik now had its volume and started trying to get a certificate. It could not:
level=error msg="Unable to obtain ACME certificate for domains \"example.com\""
error="get directory at 'https://acme-v02.api.letsencrypt.org/directory':
Get \"https://acme-v02.api.letsencrypt.org/directory\":
dial tcp 127.0.0.1:443: connect: connection refused"
dial tcp 127.0.0.1:443. Traefik was resolving Let's Encrypt's ACME directory
to its own loopback address. My first assumption was a proxy or a hosts file
somewhere, so I shelled into a pod and checked:
$ kubectl -n kube-system exec -it traefik-... -- nslookup acme-v02.api.letsencrypt.org
Server:    10.43.0.10
Address 1: 10.43.0.10 kube-dns.kube-system.svc.cluster.local

Name:      acme-v02.api.letsencrypt.org
Address 1: 198.51.100.42
It resolves perfectly. From the same pod, at the same moment, that Go program
was getting 127.0.0.1.
The difference is the search path. Kubernetes gives pods a resolv.conf with
options ndots:5, which means any name containing fewer than five dots is tried
against the search domains before it is tried as an absolute name.
acme-v02.api.letsencrypt.org has three dots. It goes through the search list
first. nslookup does not apply the search path the way the C and Go resolvers
do, which is exactly why it lied to me: it is the wrong tool for confirming what
your application will see.
So what was in the search list? Kubelet copies the host's search domains into
every pod's resolv.conf. And on this VPS, the provider's DHCP server hands out
a DNS domain of localhost:
$ nmcli device show eth0 | grep -i domain
IP4.DOMAIN[1]:  localhost

$ cat /etc/resolv.conf
search localhost
nameserver 127.0.0.53
Which lands in the pod as:
$ kubectl -n kube-system exec traefik-... -- cat /etc/resolv.conf
search kube-system.svc.cluster.local svc.cluster.local cluster.local localhost
nameserver 10.43.0.10
options ndots:5
Follow the chain. Under ndots:5, the resolver tries
acme-v02.api.letsencrypt.org.kube-system.svc.cluster.local (NXDOMAIN), then
two more cluster suffixes (NXDOMAIN), then
acme-v02.api.letsencrypt.org.localhost. And localhost resolves. It resolves
to 127.0.0.1, because that is what localhost is for. The resolver gets an
answer, stops searching, and hands 127.0.0.1 back to Traefik, which dutifully
tries to speak ACME to itself.
Every pod in the cluster had this. Anything doing outbound DNS to a name with fewer than five dots was one NXDOMAIN away from resolving to loopback. That is a much larger blast radius than a broken certificate.
The fix is to stop kubelet copying the host's search list. k3s takes a
resolv-conf option pointing at a file of your choosing:
# /etc/rancher/k3s/config.yaml
resolv-conf: /etc/rancher/k3s/resolv.conf
# /etc/rancher/k3s/resolv.conf
nameserver 1.1.1.1
nameserver 9.9.9.9
No search line. Restart k3s, delete the pods so they get a fresh
resolv.conf, and the certificate arrived on the next ACME attempt.
You could also fix it at the host by telling the network manager to ignore the DHCP-supplied domain. I did both, because a reprovision of the VPS would otherwise reintroduce it silently, and this failure does not announce itself; it just makes an unrelated program dial loopback.
Trap 3: tlsChallenge: {} becomes no flag at all
With DNS fixed, Traefik got further and then stopped with a different error:
level=error msg="Unable to obtain ACME certificate for domains \"example.com\""
error="ACME challenge not specified, please select TLS or HTTP or DNS Challenge"
I had configured the resolver the way Traefik's own documentation shows it, because Traefik's static configuration is a TOML or YAML file and the challenge is an empty table:
certificatesResolvers:
  letsencrypt:
    acme:
      email: admin@example.com
      storage: /data/acme.json
      tlsChallenge: {}
That is correct for a Traefik static config file. It is wrong here, because k3s
does not hand Traefik a static config file. It installs Traefik with its Helm
chart, and the chart flattens your values into command line arguments on the
container. An empty map has nothing in it to flatten, so it produces no argument
at all, and the resulting container never receives
--certificatesresolvers.letsencrypt.acme.tlschallenge=true. Traefik starts
with a resolver that has an email and a storage path and no challenge type, and
tells you so precisely.
The chart wants a boolean:
certificatesResolvers:
  letsencrypt:
    acme:
      email: admin@example.com
      storage: /data/acme.json
      tlsChallenge: true
You can confirm which one you got without guessing, and this is the check I should have run an hour earlier:
kubectl -n kube-system get pod traefik-... -o jsonpath='{.spec.containers[0].args}' \
  | tr ',' '\n' | grep acme
If the flag is not in that list, no amount of correct-looking YAML above it matters.
Trap 4: the chart's keys are not the documentation's keys
Same category, different key. I wanted a permanent redirect from HTTP to HTTPS. Plenty of material online tells you to write:
ports:
  web:
    redirectTo: websecure
That key does not exist in the chart version k3s bundles. It is not rejected, because Helm values are a free-form map; an unknown key is simply data nobody reads. The redirect silently did not happen. The key the chart actually reads is:
ports:
  web:
    http:
      redirections:
        entryPoint:
          to: websecure
          scheme: https
          permanent: true
There is no trick to finding this, only a habit: pull the chart and read its
values.yaml. It is the only document that is definitionally in sync with the
code that consumes it. Between a blog post, the upstream project documentation,
and the chart's own values file, the values file wins every time.
Both of these traps land in the same k3s mechanism. You configure a bundled
chart by dropping a HelmChartConfig next to it, and Flux can own that file
like any other manifest:
apiVersion: helm.cattle.io/v1
kind: HelmChartConfig
metadata:
  name: traefik
  namespace: kube-system
spec:
  valuesContent: |-
    persistence:
      enabled: true
      storageClass: local-path
      size: 128Mi
    certificatesResolvers:
      letsencrypt:
        acme:
          email: admin@example.com
          storage: /data/acme.json
          tlsChallenge: true
    ports:
      web:
        http:
          redirections:
            entryPoint:
              to: websecure
              scheme: https
              permanent: true
The part people find surprising: Flux commits to your repository
Image automation is three objects, and it is worth being precise about which one does what, because the third does something most people do not expect the first time.
ImageRepository scans. It polls a container registry on an interval and
records every tag it sees. It makes no decisions. It needs pull credentials if
the registry is private.
apiVersion: image.toolkit.fluxcd.io/v1
kind: ImageRepository
metadata:
  name: site
  namespace: flux-system
spec:
  image: ghcr.io/OWNER/site
  interval: 10m
  secretRef:
    name: ghcr-auth
ImagePolicy selects. It takes the tag list from an ImageRepository,
optionally filters it with a regex, and applies an ordering rule to pick exactly
one winner. The winner shows up in status.latestRef.
apiVersion: image.toolkit.fluxcd.io/v1
kind: ImagePolicy
metadata:
  name: site
  namespace: flux-system
spec:
  imageRepositoryRef:
    name: site
  filterTags:
    pattern: '^v(?P<version>[0-9]+\.[0-9]+\.[0-9]+)$'
    extract: '$version'
  policy:
    semver:
      range: '>=0.9.0'
ImageUpdateAutomation commits. It clones the GitOps repository, finds
fields marked with a setter comment, writes the selected image reference into
them, commits, and pushes.
apiVersion: image.toolkit.fluxcd.io/v1
kind: ImageUpdateAutomation
metadata:
  name: site
  namespace: flux-system
spec:
  interval: 30m
  sourceRef:
    kind: GitRepository
    name: flux-system
  git:
    checkout:
      ref:
        branch: main
    commit:
      author:
        name: fluxcdbot
        email: fluxcdbot@users.noreply.github.com
      messageTemplate: "Update image to {{range .Updated.Images}}{{println .}}{{end}}"
    push:
      branch: main
  update:
    path: ./clusters/vps/apps
    strategy: Setters
That last one is the surprise. Flux does not hold the desired tag in its own
state; it writes it into your git history with a deploy key that has write
access. git log on the GitOps repository fills up with commits authored by the
cluster. The first time you see the cluster commit to the repository that
describes the cluster, it reads as a loop that should not terminate. It does
terminate, because the write is idempotent: it only commits when the rendered
field differs from the policy's selection.
Trap 5: extract does not change what gets written
Look at that ImagePolicy again. The pattern captures a named group
version from tags shaped like v1.2.3, and extract: '$version' pulls out
1.2.3. So the automation writes 1.2.3 into the deployment, right?
No. It writes v1.2.3.
Extraction only affects the value handed to the ordering rule. The semver
comparator cannot parse v1.2.3 reliably, so you strip the prefix for its
benefit; but status.latestRef carries the real tag as it exists in the
registry, and that real tag is what the setter writes.
This is correct, and it is correct in the direction you want. The registry
contains v1.2.3. If automation wrote the extracted 1.2.3, the deployment
would reference a tag that does not exist and you would get ImagePullBackOff
on every release. I spent a while convinced I would need a second pattern to put
the v back. There is nothing to put back.
While you are in there, note that semver ordering is numeric, not lexical.
v0.9.19 beats v0.9.9, which is what you want and is not what a string sort
gives you. If you ever fall back to the alphabetical policy for timestamped
tags, that guarantee is gone; pad your numbers or use a format that sorts
correctly as text.
Trap 6: the marker must be JSON and nothing else on that line
This is the nastiest one, because it does not fail. It just does nothing.
The Setters strategy finds fields to update by reading a specific line
comment in your YAML:
containers:
  - name: site
    image: ghcr.io/OWNER/site:v0.9.20 # {"$imagepolicy": "flux-system:site"}
Flux parses that comment with kyaml, which expects the comment body to be a
JSON object. If it is not valid JSON, the field is skipped. Not warned about.
Not surfaced as an event on the ImageUpdateAutomation. Skipped.
So this line, which is friendlier to the next human who reads the file:
image: ghcr.io/OWNER/site:v0.9.20 # {"$imagepolicy": "flux-system:site"} managed by Fluxis a line Flux will never update. The tag stays frozen at whatever you last
typed by hand. Everything else keeps working: the ImageRepository scans, the
ImagePolicy selects a new version, flux get image policy shows the new tag,
and the deployment never changes. You will look at the healthy policy and
conclude the problem is somewhere else entirely.
The diagnostic that gets you there:
flux get image policy site          # is a new tag being selected?
flux get image update site          # did the automation run, and what did it change?
git -C homelab-gitops log --oneline -5   # did a commit actually land?
If the policy is fresh, the automation reports success, and no commit landed, the marker is wrong. Put the JSON at the end of the line, alone, and put your prose on a line above it.
The CI half, where the green tick was lying
Everything above is the cluster. The other half of the pipeline is GitHub Actions, and it produced three failures in the same period that share a single root cause: I trusted a green check mark without knowing what it asserted.
The unpinned package manager broke every branch at once
The Dockerfile installed the package manager globally with no version pin:
RUN npm install -g pnpmThat resolved to whatever the current major happened to be on the day the layer
was built. One day it resolved to a new major, which no longer reads its
configuration from the pnpm field in package.json and refuses a lockfile
written by the previous major:
Cannot verify the identity of the @pnpm/exe.linux-x64 native binary:
it is missing from pnpm-lock.yaml
Every open branch went red within an hour of each other. None of them had touched the Dockerfile, the lockfile, or any dependency. That simultaneity is the tell: when unrelated branches fail together, the change is not in any of them, it is in something they all pull from the network at build time.
The fix is a pin, kept in step with the packageManager field in
package.json so the two cannot drift:
FROM node:26-alpine AS base
# Keep this pin in step with the "packageManager" field in package.json.
RUN npm install -g pnpm@10.32.1
Anything installed unpinned in a Dockerfile is a scheduled outage with an unknown date. This includes the tool you use to install everything else, which is the one people forget.
The vulnerability scan ran after the push, and only on main
The image scan was its own job, gated on the main branch, running after the image had been pushed to the registry. Draw that out and the problem is obvious: the gate sat downstream of everything it was supposed to protect.
A pull request would go green, because the scan did not run on pull requests at all. It would merge. Then main would fail, on a finding in an image that was already published and pullable. The scan was not preventing a vulnerable image from shipping; it was writing a report about one that had shipped.
The fix moves the SBOM generation and both scanners into the build job, between the build step and the push step:
- name: Build image
  run: docker build --tag "$IMAGE" .

# Scanning runs here, between build and push, so a pull request is gated on the
# same findings as main and a failing image is never published.
- name: Generate SBOM with Syft
  run: syft "$IMAGE" -o spdx-json > sbom.spdx.json

- name: Scan with Grype
  run: grype sbom:sbom.spdx.json --fail-on critical

- name: Tag and push
  if: github.event_name != 'pull_request'
  run: docker push "$IMAGE"
A pull request now builds and scans exactly the artifact main will see, and stops before publishing it. The push step is the only thing gated on the branch.
Worth saying separately: the blocking bar is critical, not high. The upstream base image periodically carries high findings that are fixed upstream but not yet in a released tag, which a downstream repository cannot action. Gating on high fails builds for changes that did not cause them, and a gate people learn to ignore is worse than no gate.
The build job never ran the linter or the type checker
The last one is the smallest and the most instructive. The CI pipeline built a
Docker image. It did not run pnpm lint or pnpm tsc --noEmit, because the
production build does not need them and nobody had wired them up.
So when the ESLint 10 bump landed, CI stayed green. The image built. The site worked. And locally:
$ pnpm lint
TypeError: contextOrFilename.getFilename is not a function
A transitively pinned eslint-plugin-react was calling an API the new major had
removed. The
linter was not reporting violations; it was crashing before it could report
anything. That state persisted through several green builds.
A successful next build asserts that the code compiles and the bundler is
happy. It does not assert that static analysis passes, that types check under
your project's tsconfig, that tests pass, or that the linter can even start.
Those are different claims and they need their own jobs.
That is the thread joining all three: know exactly what your green tick asserts, and read the job trace instead of trusting the check mark. A job can pass while doing nothing. A job can pass while running after the thing it was supposed to gate. A job can pass because the check you assumed was in it was never added.
What it actually cost
The deploy is now a git commit that the cluster makes to itself. I write a version tag, CI builds and scans and pushes an image, Flux notices the tag, commits the new reference into the GitOps repository, reads its own commit back, and rolls the deployment. Nothing I control touches the VPS. The reverse proxy stays up across releases because nothing tells it to stop.
I am not going to claim this is simpler. It is not. Docker Compose on one box is simpler, and for one static-ish site on 1 vCPU it is a defensible choice that I would not argue anyone out of. What changed is not the amount of complexity but where it sits: it moved out of a bash script nobody reviews and into declarative state that is reviewed, versioned, and revertable.
The debugging surface moved too. It did not shrink. I no longer debug an SSH
session that half-ran; I debug why a Kustomization is not ready, why a policy
selected a tag that no controller wrote down, why a resolver in a pod disagrees
with nslookup in the same pod. Those are better problems in the sense that
they are inspectable from my laptop, and worse in the sense that four of the six
traps above were things the documentation did not say and only the source or the
packaged manifest could tell me.
If there is one habit worth taking from this: when a system offers you a switch,
a value, or a marker, go and read the thing that consumes it. The chart's
values.yaml, not the project's docs. The distribution's packaged manifest, not
its feature list. The parser's expectations for that comment, not the shape of
the comment that looks right. Every one of these traps was visible from the
consuming code and invisible from everywhere else.